

Why now
Multifamily has already taken its loss.
Supply is falling faster than prices. That gap is the window.
−52%
U.S. apartment deliveries, 2024 peak to the 2027 trough
Yardi Matrix, Feb 2026
≈ −19%
Apartment values below the 2022 peak, while equities trade near records
Green Street CPPI, Jun 2026
≈ 90 bps
Institutions below their real estate allocation targets
Hodes Weill & Cornell, 2025
U.S. multifamily completions, thousands of units
The 2027 trough is less than half the 2024 peak.
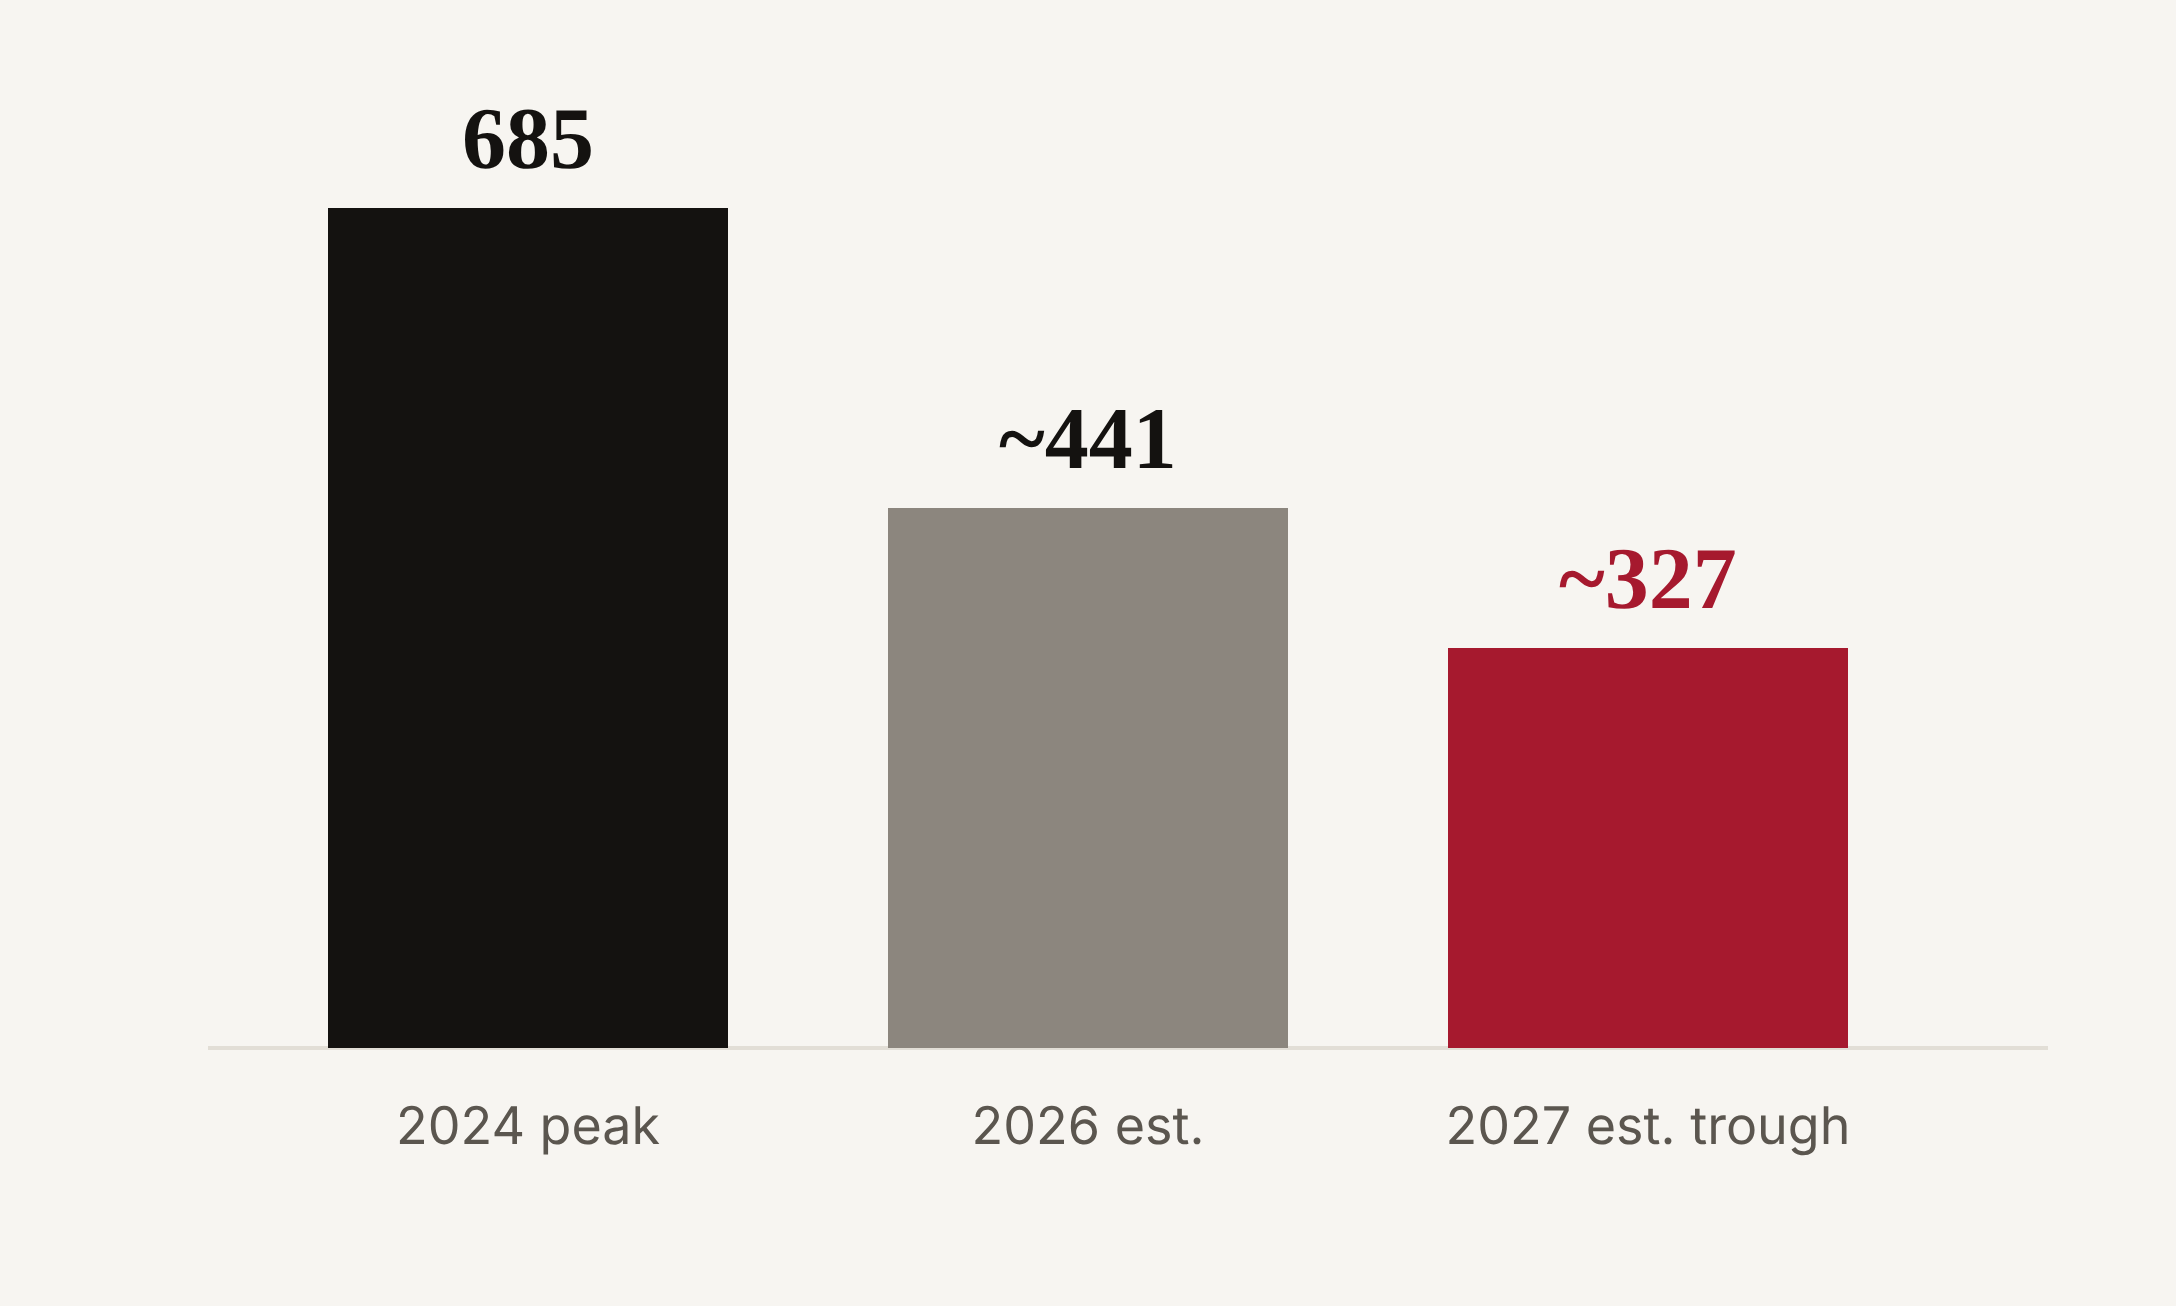
Source: Yardi Matrix, Feb 2026. Estimates are third-party forecasts, not guarantees.
Why the window won’t stay open
Distress
$1.5T+ maturing
Commercial real estate debt coming due, with the maturity wall peaking in 2027. Motivated sellers and lenders, not forced bargains.
Morgan Stanley; S&P Global Market Intelligence
Basis
Below replacement cost
Acquisition prices below the cost to build, for the first time in over a decade. Replacement cost has historically supported values over time.
Blacklion analysis; see basis chart below
Liquidity
$7.8T on the sidelines
Parked in money market funds, near record highs. When rates ease, that capital looks for income.
ICI, May 2026
Redeployment into real estate has begun. Early movers capture the best basis.
“With the cost of capital and new supply trending downward, Blacklion views this as a compelling opportunity to deploy capital.”
Jim Gatlin, Co-Founder
What we don’t know yet: the trough isn’t confirmed, and cap rates sit near an 11-year high. That is why we underwrite exit cap rates at or above today’s market levels. Data as of October 2026; reviewed quarterly and subject to change.
History rewards early capital
15.5%
Average five-year unlevered returns for investments made in the “Early Buy” phase of the cycle, with an average risk multiplier of 0.68.
Hines Research; 80,000+ observations incl. NCREIF, JLL, CBRE. Market-level research, not Blacklion results or a projection.
Post-GFC vintages that deployed into the reset ranked among the strongest of the last two decades. Those that waited for the recovery to be obvious paid more for the same income.
“You are neither right nor wrong because the crowd disagrees with you. You are right because your data and reasoning are right.”
Benjamin Graham, The Intelligent Investor
The strategy
Buy the reset. Own the burn-off. Sell to core capital.
We focus on acquiring institutional-quality, late-cycle multifamily product (2022–2026 deliveries) in markets benefiting from long-term secular trends, including technology and demographics. We believe the balance of 2026 through 2027 will allow capital to be deployed ahead of the herd. We seek value-add to opportunistic returns from newly built assets with core-like characteristics: well-located, stabilized Class A, free of renovation or lease-up risk.
Value at entry. Growth in the hold. Alpha at exit.
01
Buy the reset
Newly built Class A communities, typically 25–35% below replacement cost on our recent underwriting (basis varies by deal), from motivated sellers and lenders. A developer is unlikely to build competing product for what we pay.
02
Own the burn-off
Assets about 95% occupied but held down by concessions. As concessions clear over 12–24 months, the same rent roll earns more, with no renovation program.
03
Sell to core capital
A target three-year exit when institutions return to bid for stabilized, growing income. Our exit is triggered by evidence, not hope.
Benjamin Graham called it the margin of safety: pay meaningfully less than an asset is worth, so you don’t need to be right about everything. In multifamily, intrinsic value has two hard anchors: what it costs to build, and what the income is worth. We buy at a 25–35% discount to the first and let the second recover.
“As value investors, we focus less on trying to time the market and more on acquiring assets that meet our investment strategy when prices not only look comparatively attractive, but are also persuasive on a risk-adjusted basis.”
Tim Young, Co-Founder
Basis is our margin of safety
What we pay, against what it costs to build and what the same product traded for at the last peak. Replacement cost = 100.
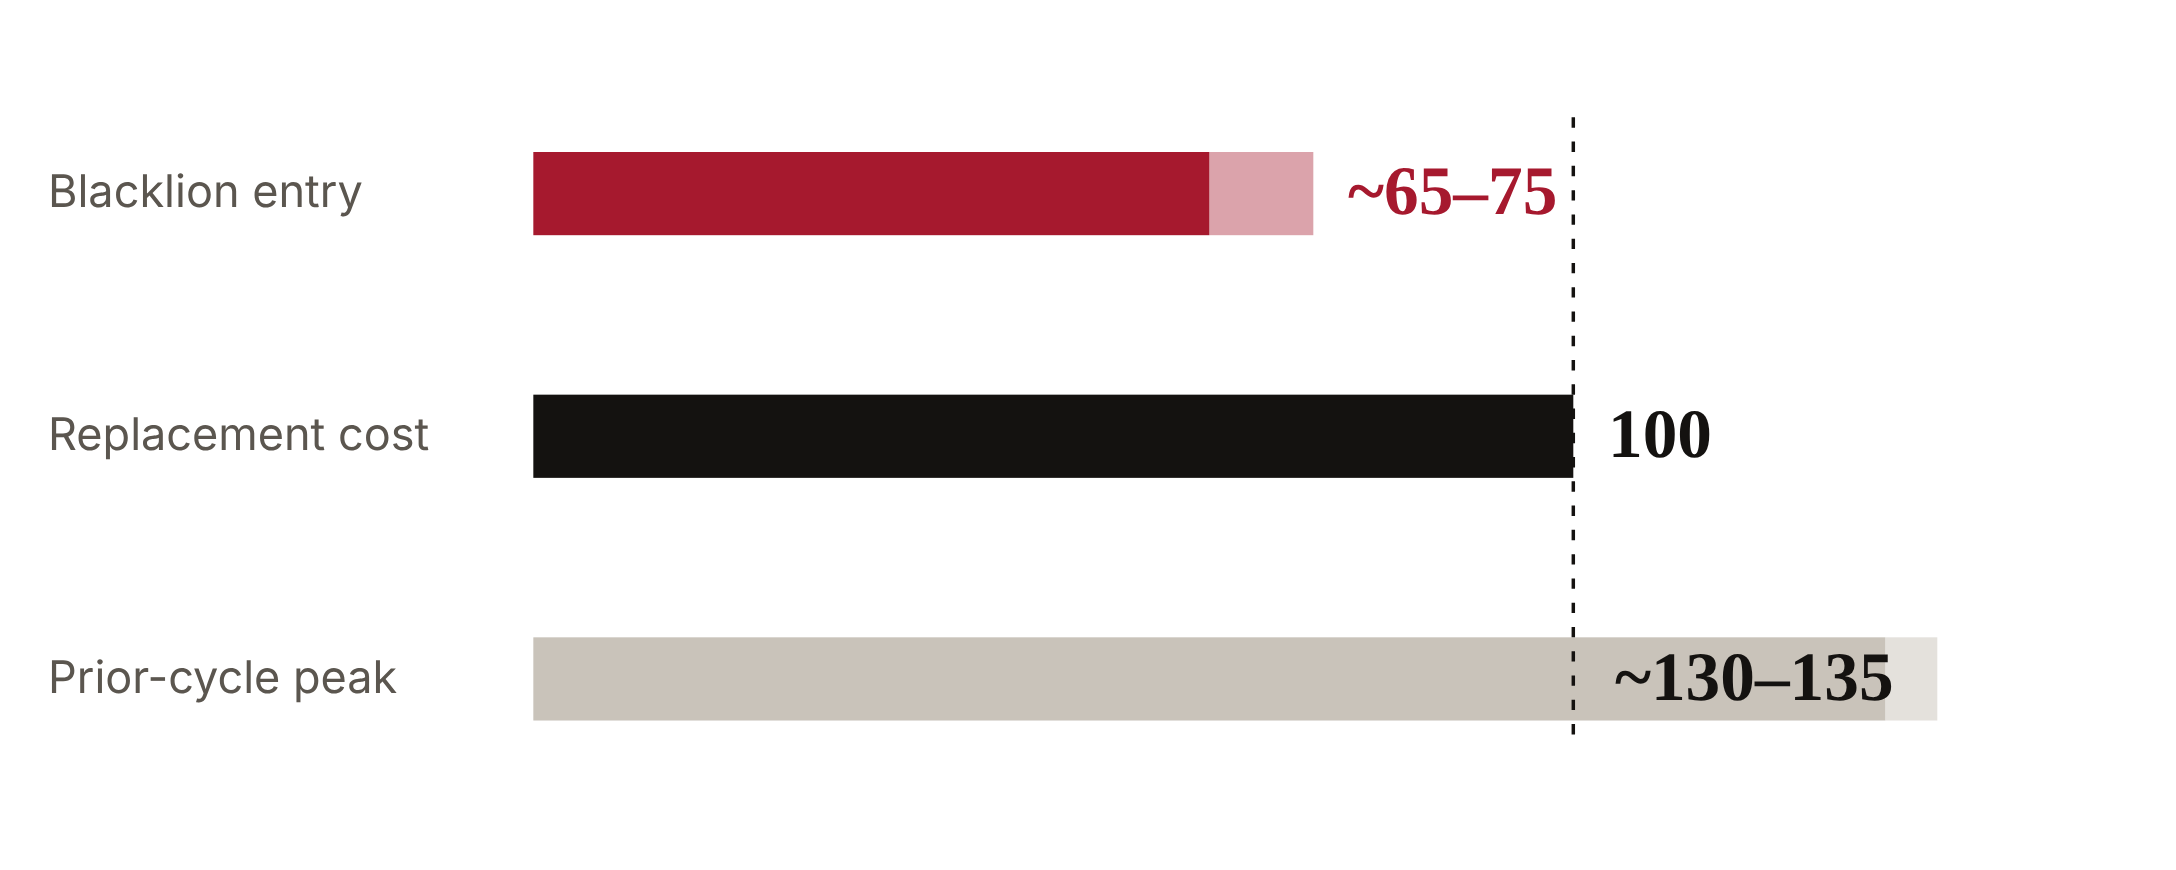
Illustrative, Austin, submarket- and product-matched. Replacement cost: RSMeans, cross-checked to a Walker & Dunlop estimate. Prior peak: Walker & Dunlop comparable sales. Basis varies by deal.
Entry
Roughly 25–35% below replacement cost, and well below prior-cycle peak values, on a submarket- and product-matched basis.
Base case
Underwritten with no cap-rate compression below today’s market levels. Recovery is upside, not the plan.
Upside we don’t underwrite
Renewal discipline, revenue management, ancillary income, expense control and resident experience.
Three cap rates matter. We buy at a going-in cap rate held down by concessions; as concessions clear, the yield on our basis rises to a stabilized cap rate; and we underwrite the exit at or above today’s market cap rates for the asset. Our return comes from that gap, not from assuming market cap rates fall.
Asymmetry, by construction
Basis is designed to cushion the downside. Several sources of upside we don’t pay for.
What protects the downside
Basis below replacement cost. We pay roughly 25–35% less than it costs to build the same asset.
Disciplined exits. Exit cap rates are set deal by deal for the market and asset, at or above current market levels for comparable product. We never assume market cap rates fall below today’s.
Moderate leverage. 50–60% LTV targeted, fixed or capped debt, and a five-year hold as the fallback.
Income from day one. Newly built assets about 95% occupied: no lease-up and no renovation program.
What drives the upside
Concession burn-off. The same rent roll earns more as concessions clear over 12–24 months.
The supply trough. Deliveries fall by half, and little new competing product is expected to arrive before our target exit.
Institutional return. Core buyers come back to bid for stabilized, growing income, and cap rates have room to come in.
Operating levers. Renewals, revenue management, ancillary income and expense control.
The base case does not depend on the upside. If the recovery comes late, we hold; if it comes on time, our partners share in the upside.
The moat: cost and time
We acquire what is costly to replicate. We hold what is hard to compete away. We operate to capture the full value of every asset we own.
The moat is time. A project started today needs 30–57 months to deliver. Our concession burn-off needs 12–24. Three barriers stand between new supply and our hold, and any one is enough.
3–12 mo
Permits. Plan check, structural and life-safety review, even after entitlement. Austin runs 6–12 months.
Innergy Integral
18–28 mo
Construction. Permit to certificate of occupancy for 20+ unit buildings; mid-rise takes the longest in a decade.
NAHB Survey of Construction, 2024
+40%
Economics. Construction costs since 2019. At today’s rents, a new project falls 75–150 bps short of the yield developers need. It doesn’t pencil, so starts are down 40%+ from peak, and we own the same product for less than it costs to build.
AGC; Blacklion analysis
Our hold vs. a project started today · months from today, illustrative
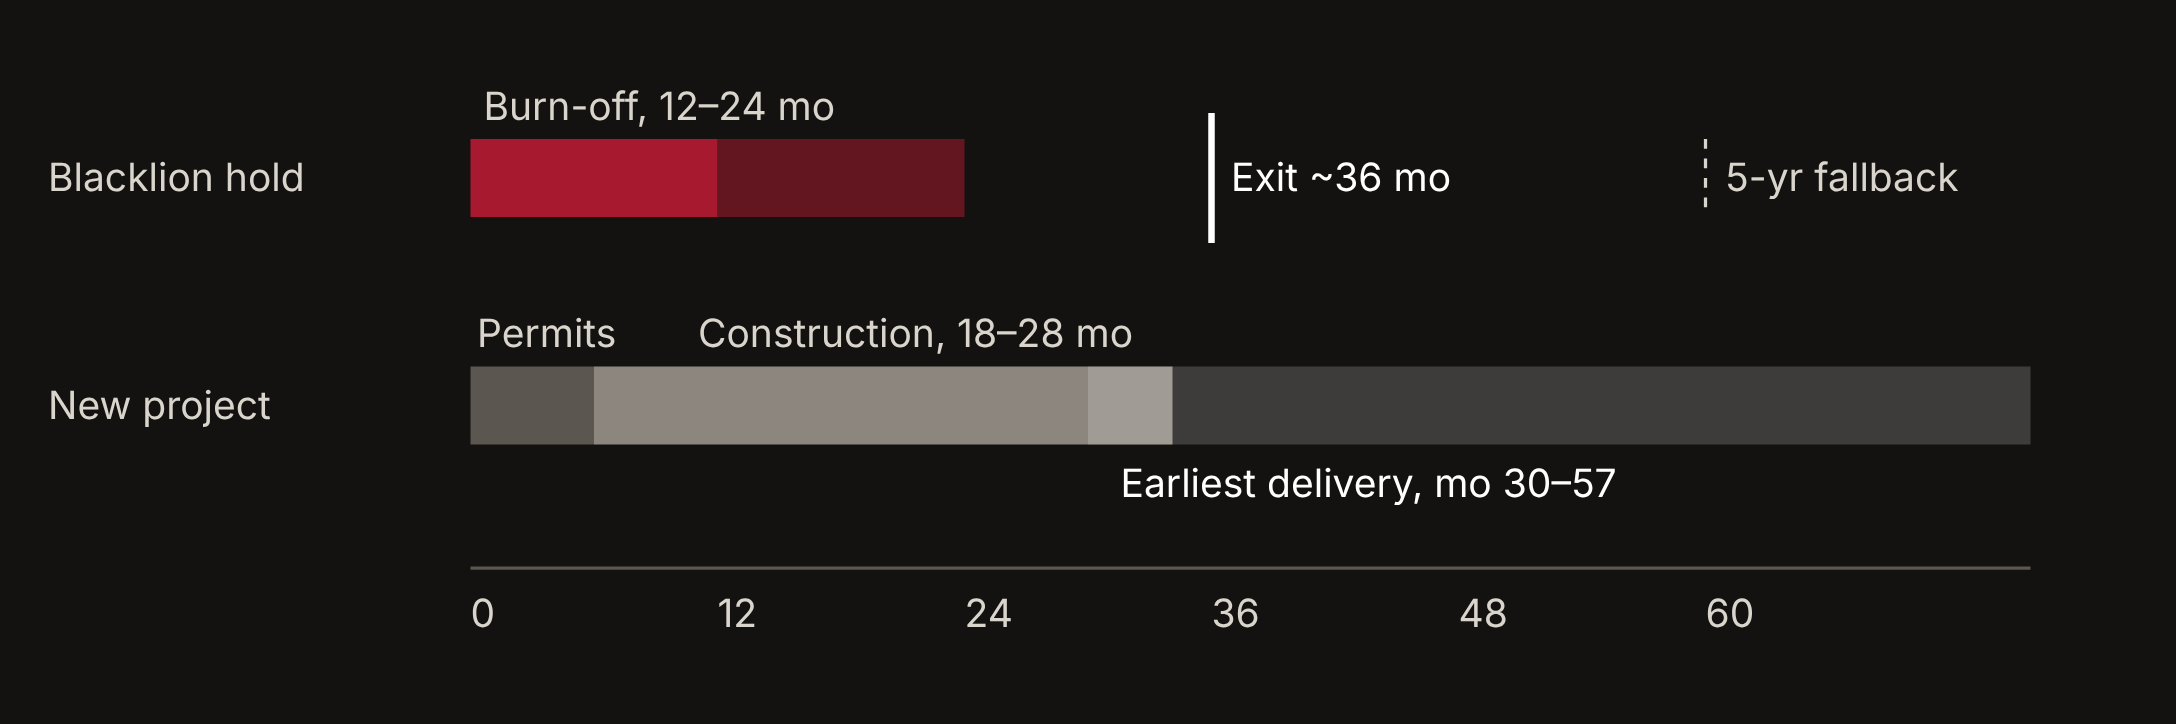
Supply that could arrive near our exit isn’t assumed away: it’s priced into the exit cap rate.
Exit signals we track
We buy while institutions are absent and sell when they return.
More than one way out. We underwrite a sale to core capital, but keep other routes open: a single-asset sale, through a broadly marketed process or off-market to a strategic buyer; a portfolio sale to buyers who pay for scale; a refinance or recapitalization at stabilized value, returning capital while we hold; and, where it suits investors, contribution to a REIT for operating-partnership units, which can defer tax.
74% of investors name multifamily their top target (CBRE, 2026)
2027 deliveries down about 24% year over year, the cycle low (CoStar; Yardi)
About 2.4% expected over the next 12 months; we look for more than 3% (RealPage)
$36.7B in Q2 2026, flat year over year (MSCI)
5.79% in Q2 2026, an 11-year high (RealPage)
As of October 2026. Reviewed quarterly and subject to change.
What we buy
Newly built. Professionally managed. Bought below cost.
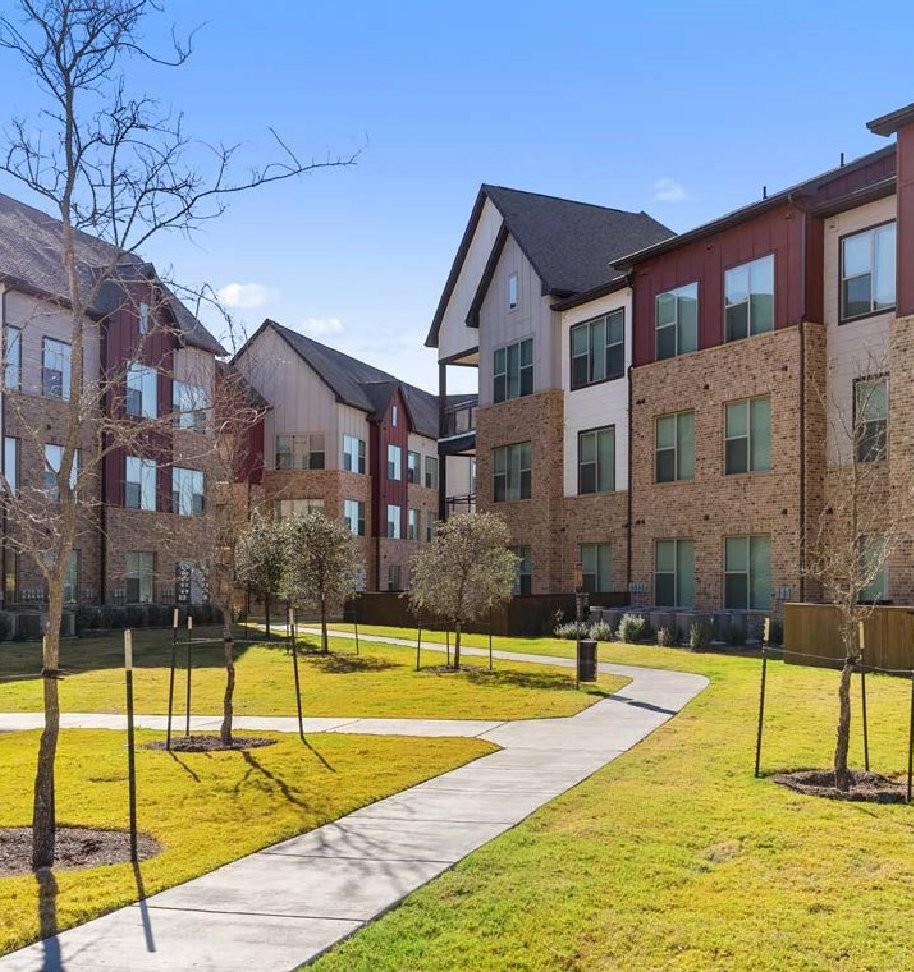
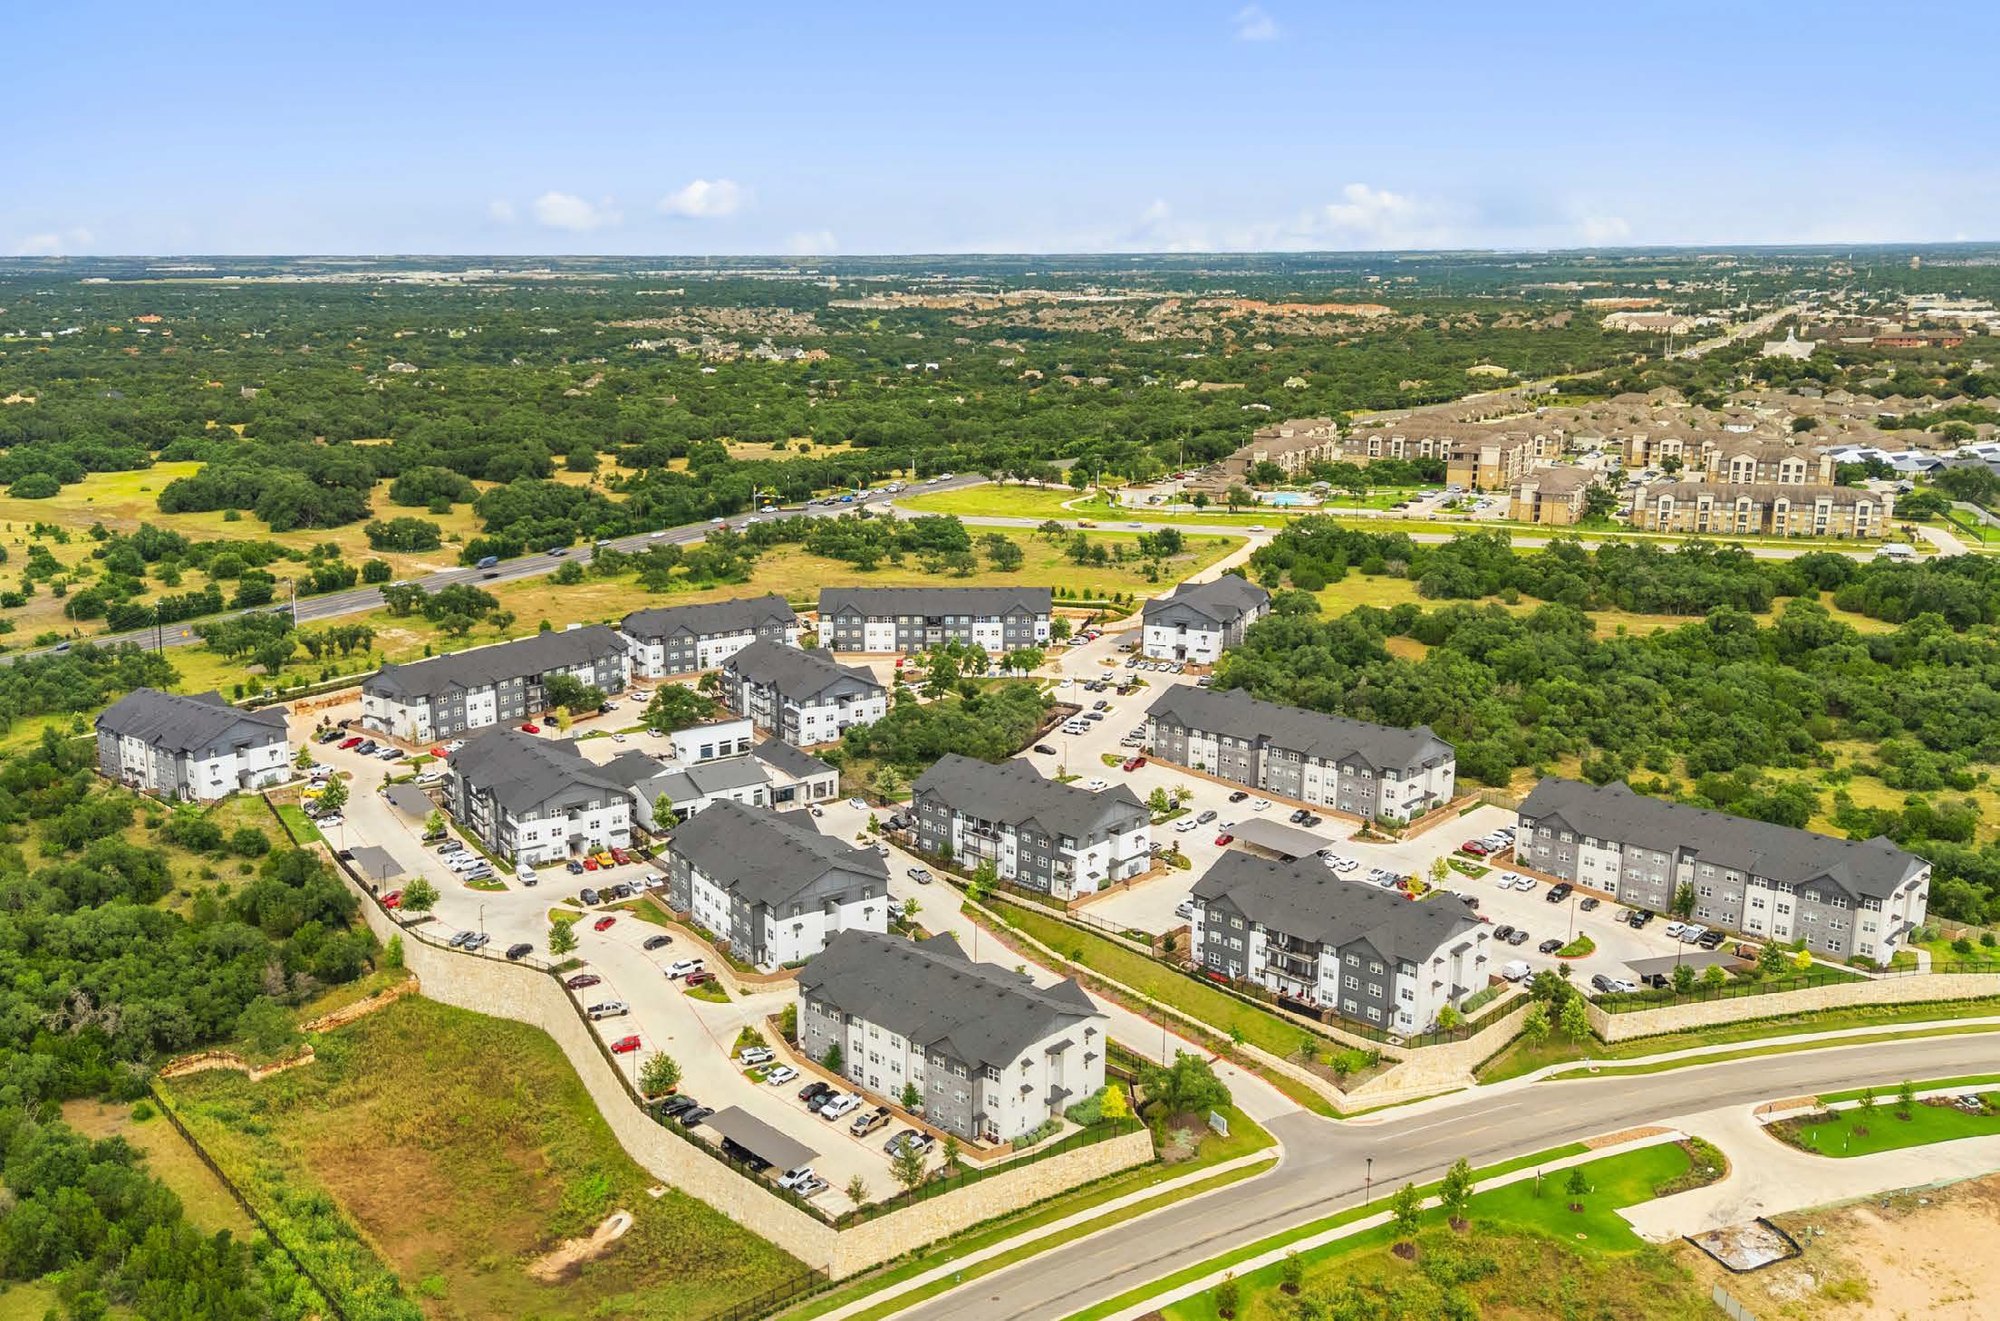
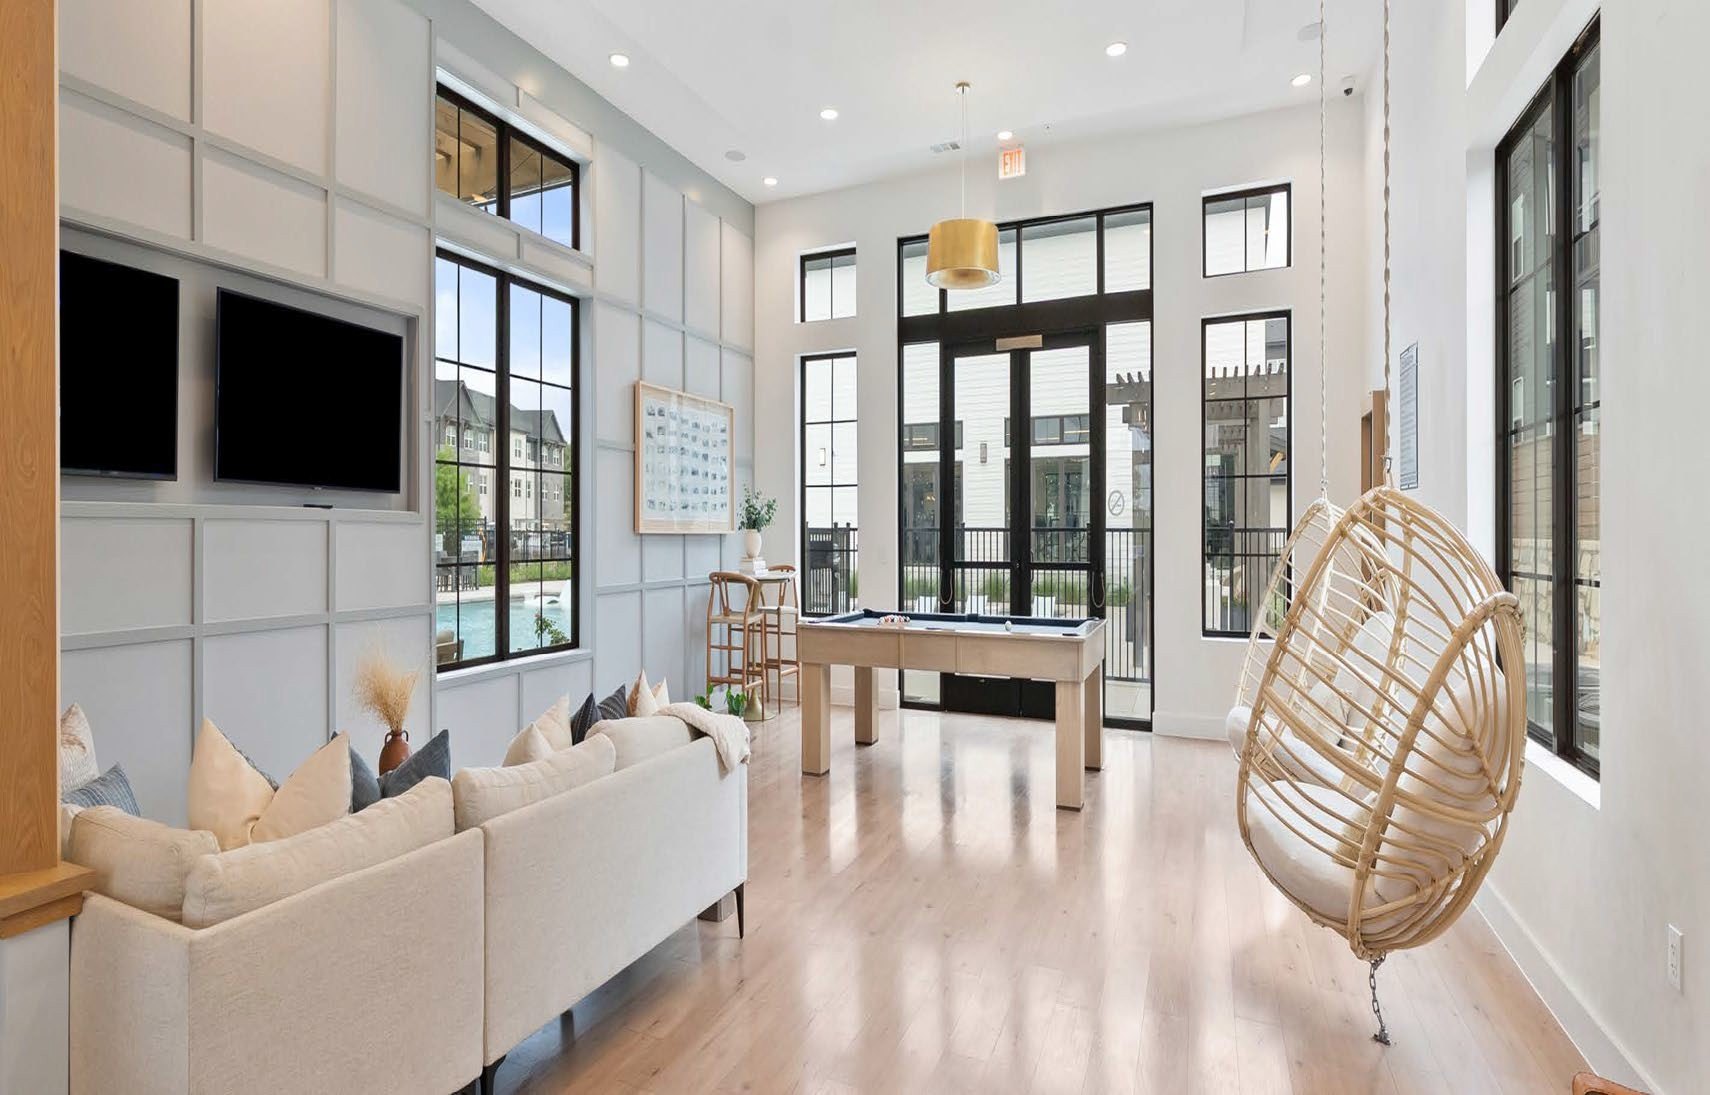
Representative images.
Where we invest
Guardrails, in writing.
| Product | Class A / A+ apartments, delivered 2022–2026 |
|---|---|
| Markets | Texas, the Carolinas, Atlanta, Nashville and select Florida markets |
| Residents | Renters by choice, incomes at least 3x rent |
| Leverage | 50–60% LTV target, 65% maximum |
| Debt | Fixed rate, or floating with a rate cap; step-down or assumable for exit |
| Hold | 3–5 years; 3-year target |
| Structure | Deal-by-deal SPEs. Not a blind pool: you see every asset before you commit. |
Risks we underwrite
Named, not ignored.
| Cap rates keep rising | Exit cap rates underwritten at or above today’s market levels for the asset, never below. |
|---|---|
| Concessions linger | Submarket supply verified deal by deal before we commit. |
| Leverage magnifies losses | A 19% value decline cuts equity by about 38% at 50% LTV and about 48% at 60%. That is why we stay in that range and never exceed 65%. |
| The exit window opens late | A five-year hold is the underwritten fallback. |
| Sponsor conflict | We benefit when investors allocate to multifamily. We say so, and source every figure. |
“We are not asking you to believe in an extraordinary recovery. We are asking you to recognize an extraordinary entry point in an ordinary cycle.”
Blacklion Brothers Holdings
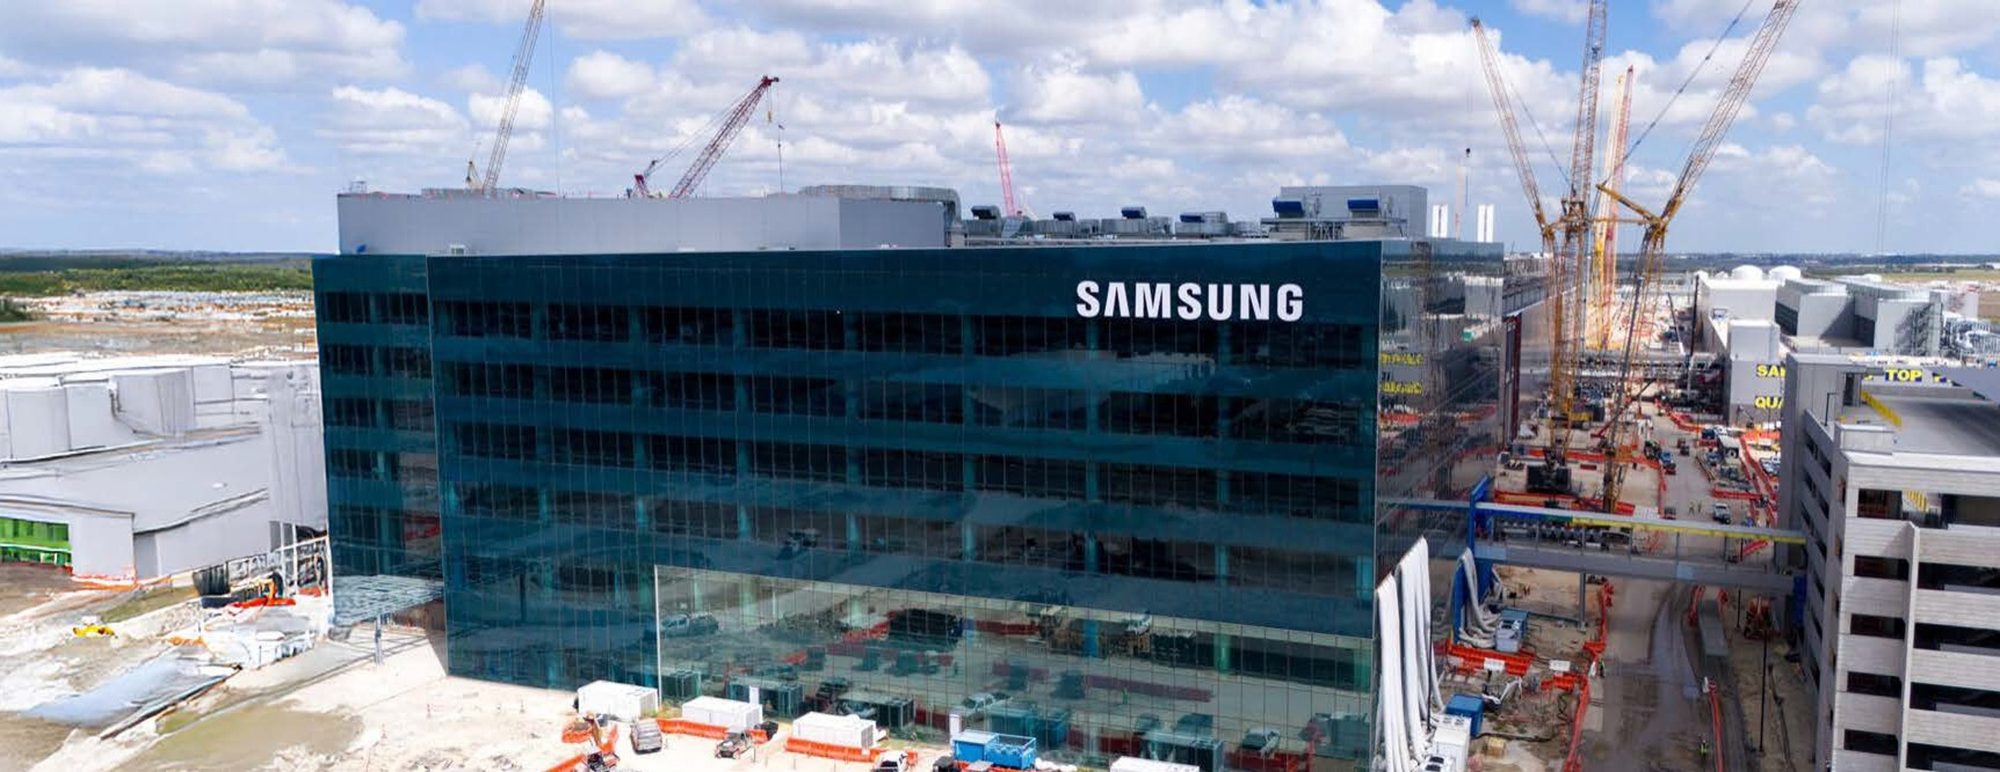
Our home market

30%
Population growth, 2015–2025, the fastest of any major U.S. metro
43%
Employment growth over the same decade
16.8%
Rent-to-income ratio, vs. a 24.7% U.S. average: room for rents to grow
42%
Share of households that rent
Sources: JLL Research, Oxford Economics, U.S. Census (2024), U-Haul.
The talent engine
The University of Texas at Austin sits just north of downtown. It feeds the city a steady supply of graduates, research and new companies, and with them a deep, renewing base of young renters.
55,000
Students enrolled, fall 2025, a record
15,963
Degrees conferred in 2024–25, a record
No. 2
Public university nationally for startup creation; 48 spinouts in three years
Sources: UT Austin (September 2025; January 2026), citing PitchBook (2025).
Next step
One well-bought asset at a time.
For information only. Not an offer to sell or a solicitation of an offer to buy any security. Any offering is made only through definitive offering documents to verified accredited investors. Investing involves risk, including loss of principal. Past performance is not indicative of future results. Forward-looking statements and targets are not guarantees. Named firms do not endorse Blacklion. Intended for U.S. residents only. Information is subject to change and revision without notice. See Acquisition criteria, Important Disclosures and Privacy Policy.

